Get free website analytics, while protecting privacy. Learn more
Cloudflare Analytics
Unlock the power of your data
Cloudflare Analytics empowers you with deep insights and intelligence to protect and accelerate your Internet property.
Granular visibility into your cache

Get actionable insights into the caching of your website for a better cache-hit ratio and further drive down your bandwidth costs.
- See exactly what resources on your website are cached and what aren’t. Make configuration changes to improve cache-hit ratios.
- Get dashboard views of your website performance based on the Requests served and data transfer to optimize for performance as well as cost-savings.
- Filter by hostnames, or see a list of top URLs that missed cache using intuitive drill-down graphs right from the dashboard.
Zero setup. Comprehensive data.
Get up and running without any code deployment.
- Metrics are collected server-side ensuring analytics are not affected by ad blockers or end-users turning JavaScript off.
- Accurate data that does not impact the speed of your website.
One API endpoint to rule them all.
All analytics are available from one flexible endpoint, based on the industry-standard GraphQL specification.
- Get analytics on HTTP requests, Firewall events, Load Balancing requests, and more.
- Group by multiple dimensions, filter, and perform various operations.
Beautiful, intuitive dashboards.
High-level dashboards provide overviews of your traffic and security postures.
- Understand broad patterns as well as drill down to individual events.
- Quickly survey malicious IPs blocked, the geographical distribution of your users, or see cache-hit rates for your website.
Firewall Analytics has given us greater visibility and clarity on our traffic. We can now easily review blocks and challenge events as well as recent activity for each individual Firewall Rule from the intuitive UI.
Mark Bell
Systems Administrator
Dashboards with insights at the level you need
Start with a high-level overview of your traffic, security, and performance.
Drill down to product-specific dashboards to get the full story.
- See the number of total requests, requests cached, bandwidth saved, and unique visitors.
- Dive into analytics for an individual domain or get a consolidated view of the analytics for all the domains in your account on a single page.
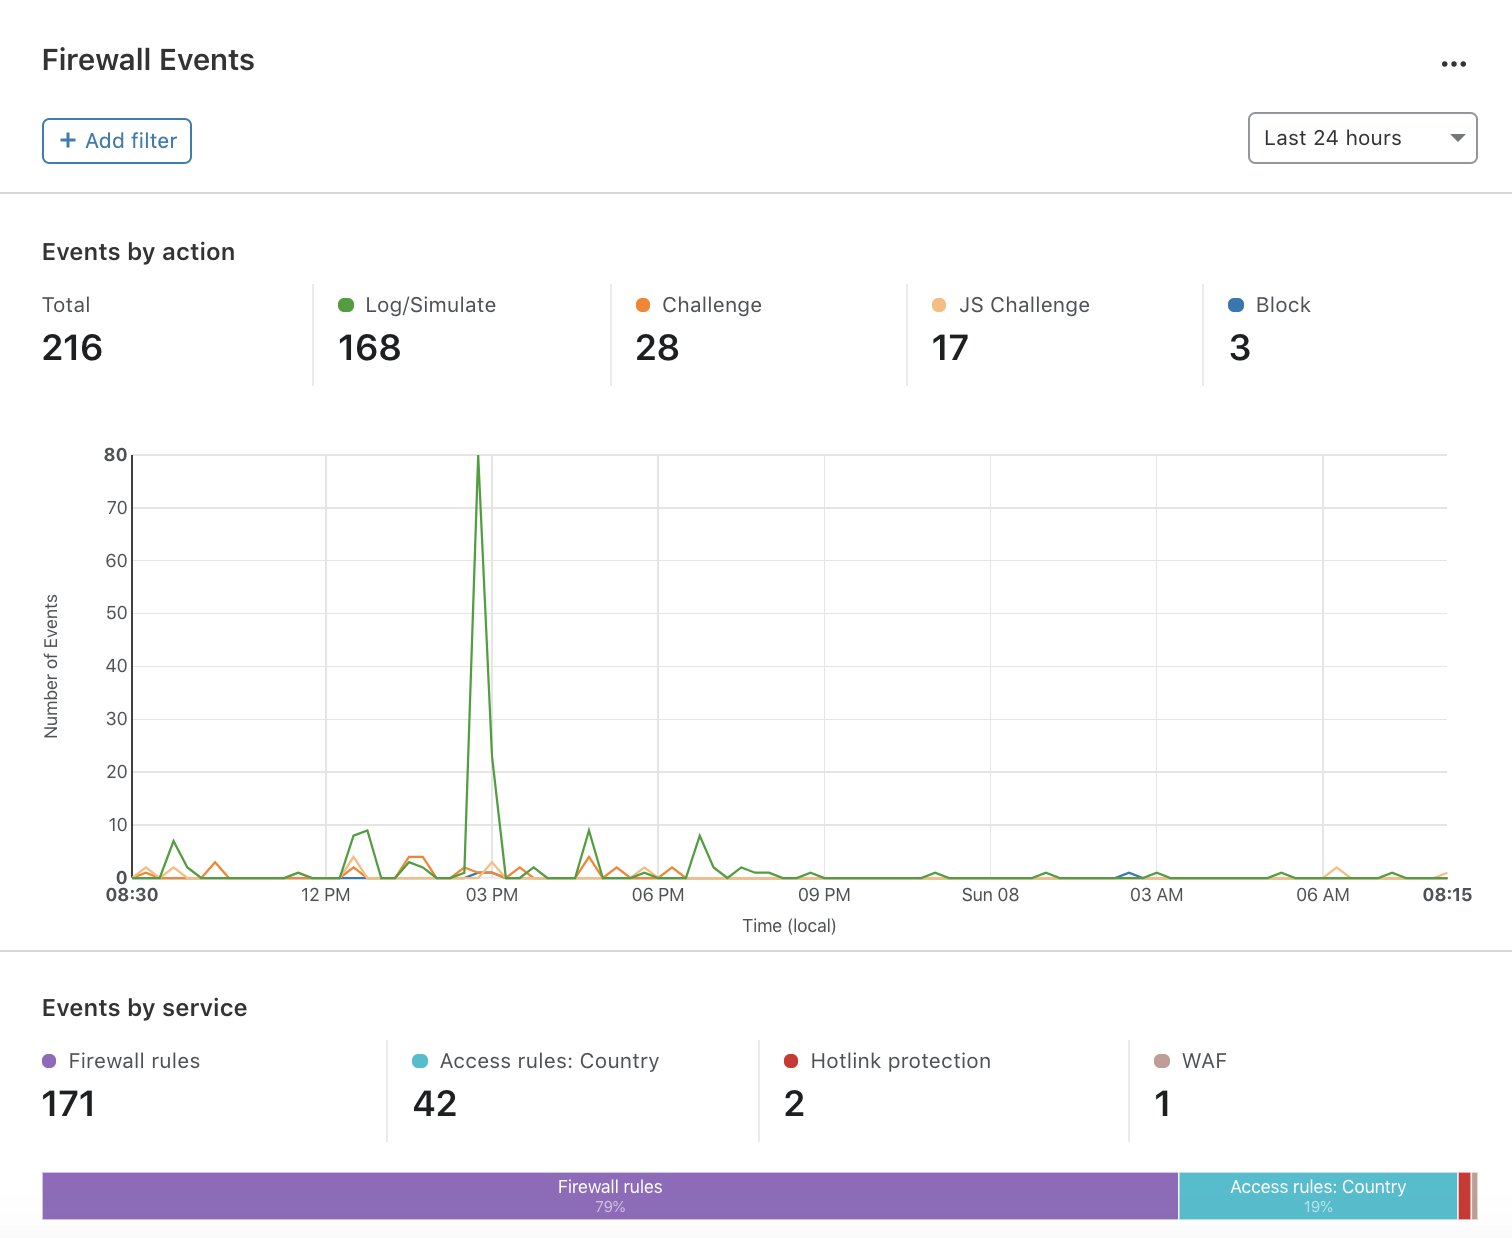
Firewall
Better understand the threat landscape by viewing all firewall events in one place.
- Filter top events by source or action taken. View DoS attacks mitigated, and distinguish between actual threats and false positives.
- See the captcha solve rate inline per rule to mitigate bots more effectively.
Load Balancing
Survey the traffic distribution across your load balancers.
- Understand behavior during peak traffic and failover decisions made, with the option to filter by load balancer, pool, origin, and region.
- Optimize your infrastructure configuration and maximize your application reliability.
DNS
Get instant insights on the DNS traffic to your website.
- Dig into your DNS query traffic by Response Code or Query Type.
- View aggregate queries for a specific domain or by DNS record, and get a geographical distribution of your DNS queries over time.
Democratize data with the GraphQL Analytics API
The GraphQL Analytics API is the engine that powers all the product analytics on the Cloudflare dashboard.
With a standard and flexible syntax, query your own virtual data warehouse full of metrics and logs regarding the performance, security, and reliability of your Internet property. Build dashboards with flexible filtering, sorting, and drilling down or rolling up.
We’re democratizing data by empowering you to build powerful, sophisticated, and bespoke analytics dashboards – that are meaningful to you.

Cloudflare monitoring tools help you debug origin server issues and accelerate remediation efforts in the case of downtime.
Due to Cloudflare’s unique vantage point at the network edge, it is well-positioned to monitor the health of your server (actively or passively) and notify you when it’s down.
No need for third-party origin monitoring tools.
Standalone Health Checks
Determine the status of your origin and get notified when your server is detected to be down.
- Configure the targeting of your health checks using metrics such as frequency, timeout period, and response code right from the dashboard or the API.
Zero Downtime Failover
Your end-users observe no downtime, even if your primary server is down. Peace of mind has never been so easy.
- If your primary server is down, a client request will failover to another configured server.
- The alternate record could be either an A/AAAA DNS record or another origin server in the same Load Balancing pool.
Passive Origin Monitoring
Get notified and diagnose origin server issues quickly for minimal downtime.
- Requires no configuration at your end – it’s enabled by default.
- Configure where notifications get sent via the Notification Center dashboard.
Trusted by millions of Internet properties
